atmos:citation:cals:spp:home
Table of Contents
SPP Performance Checks
August 2012 FSSP Bead Calibration Test Spreadsheet
FSSP Bead Calibration Spreadsheet
Saudi Arabia SPP Performance Check Document
Saudi 2008 FSSP Calibration Checks
North Dakota FSSP Performance Check Document
|North Dakota 2008 FSSP Calibration Checks
FSSP DMT Calibration Report
FSSP DMT Calibration Report
Obtaining Data from Standard Size Beads
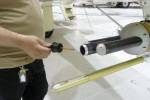
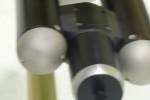
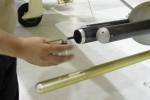
- Insert nozzle into front openning of FSSP.
- Clean out the bead injector by gently spraying compressed air into the container.
- Wash out the bead injector vial with a small bit of distilled water. Discard water.
- Wipe out excess moisture with a paper towel or kimwipe.
- Dry vial by spraying compressed air into the vial. Gently spray rest of bead injector with compressed air to remove any remaining beads.
- Be sure not to have ANY moisture enter the bead injector
- Note size, type, catalogue number and expiration date of beads used.
- Should start with the large bead sizes, then move to successively smaller bead sizes.
- Pour into the injector less than a pinch of the bead sample.
- Add the smallest amount of the sample as possible.
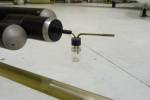
- Place cap on the injector and insert inlet into the nozzle protruding from the FSSP
- Gently spray compressed air into injector. Gradually increase the pressure applied and continue spraying until bead samples have been blown into the FSSP.
- Repeat the process with any other samples to be tested. Be sure to clean injector between each run.
Processing SPP Performance Checks Data.
- Find the post processing directory within the day you want to review.
- This page will be referring to the date 08/02/06. The path to this post processing directory is /nas/2008/08_02_06
- Find the time, bead size, and which instrument the test was on.
- There is usually a readme file of some sort within the post processing directory. The times of each test should be found within this file.
- For 08/02/06, the readme file has many tests. This page will use the first test.
- Note the time, bead size, and instrument. For this test the time is 7:05:55, bead size is 15um, and the test was on the WMI SPP.
- For the SPP, the calibration checks take about a second or two. The times given in the readme files are approximate and we will use cplot to find out the exact time interval of the test.
- Convert the time to seconds from midnight. In a terminal, run
time_convert.tcl
This opens a program that converts the time to seconds from midnight. Using time_convert.tcl, 7:05:55 converts to 25555 seconds from midnight.
- Find the correct counts file to open. If the data file has not been create and you only have a *.sea file, then process the data file using 'process_raw *.sea', where *.sea is replace with the name of the sea file.
- Within this particular directory there are two sets of data within the same day. The difference is the time which is within the first part of each file name. Each file starts with yy_mm_dd_hh_mm_ss where yy is the 2 digit year, mm is month, dd is day, hh is hour, mm is minutes, and ss is seconds which is the date and time that the data started. The times differ.
- The two different times on this day are found in the hh_mm_ss part of the file names. The two times are 6:57:04 and 11:49:53.
- The time of the test found in the readme file, 7:05:55, closely corresponds to 6:57:04 so we want to use the file with this time.
- Also, in this particular directory there is data for two different SPPs. The title for the WMI SPP is “spp_fssp” and the title for the NRL SPP is “spp_fssp2”.
- Since we know what time we want and we know which SPP to look at, the file we are looking for is 08_02_06_06_57_04.counts.spp_fssp.raw
- Open the counts file with cplot. In a terminal within the post processing directory, run
cplot 08_02_06_06_57_04.counts.spp_fssp.raw
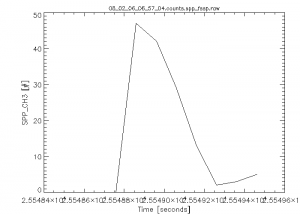
- Plot Time vs. Counts in a channel.
- X Axis → Time
- Y Axis → SPP_CH3
- Click on Plot → XY Graph
- Note: This gives you the counts in channel 3. There should be spikes in other channels also. Other channels should also be checked.
- Find the exact interval of the test using cplot.
- Pick an interval to look for the spike. The time given in the readme file converted to seconds from midnight is 25555. Since this is approximate, a peak should show up in the data between 25500 and 25600. To select this time interval, click on Control → Time Interval.
- After you enter a start time, you must press enter. Same with the end time.
- After the time interval is changed, replot the graph. Plot → XY Graph
- This should produce a graph that is zoomed in on a peak.
- Using the time interval feature, keep zooming in on the peak and find an exact start and end time for the peak.
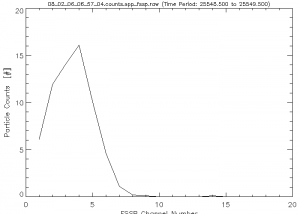
- Plot the spectrum and note the numbers from the plot. Do this by first clicking on Edit → Options → Display Text. Then click on Plot → Spectrum. This should display your plot of the spectrum and also the number of counts in each channel.
- Find the pre-peak, peak, and post-peak counts. Do this first by looking at the plot of the spectrum. Find the channel of the peak on the plot. In the example, the peak channel is channel 4. The values in the text window are the counts in each channel. In the example, the pre-peak counts are 14.1, peak counts are 16.1, and post-peak counts are 10.0.
Creating and working with a Performance Check Spreadsheet
Start the ADPAA Cplot Program
- Cplot *.counts.ssp_FSSP.raw
- Create a plot of time vs. total number of counts.
- Use the bead calibration test 'readme' file to find corresponding times for each bead size.
- On Cplot select, set the desired time interval.
- Select 'Edit' → 'Options' and hightlight 'Display Data' on Spectrum Mode.
- Select 'Plot' → 'Spectrum'
- Note: start & end times (sfm); along with pre, peak, and post channel counts.
- Repeat process for each bead size.
On Spreadsheet
- Create chart with following columns: Start time, End time, Peak Channel, Pre-Peak Count, Peak Count, Post Peak Count, MOD, Bead Size, Water Equivalent Size, Cal. Avg Size, and Standard Channel. Input Values
- Note: MOD - mode FSSP was operated in operated- is most likely '0'.
On Terminal
- Type 'avg_channel'
- Input: bead size, peak, pre-peak and post peak channels. Output will be Average Channel, Water Equivalent Size, Standard Channel Size.
- Water equivilant size can also be found using the following formula: y=-0.00006737×4+0.00654087×3-0.21861587×2+3.71178039x–12.24371265 ('x'= bead size). And the 'standard channel value' (y - Std CH) can be calculated using the water equivalent size (x - Water Eq. Size) and the fitting equation y=-0.0021*x2+0.5753*x–1.503.
- Input all values into the spread sheet.
Example: 08/02/06
| Date | 08/02/06 |
|---|---|
| Start Time | 25548.5 sfm |
| End Time | 25549.5 sfm |
| Peak Channel | 4 |
| Mode | 0 |
| Size | 15.0 um |
| Water Equivalent Size | 12.93 |
| Average Channel | 3.898 |
| Standard Channel Size | 5.574 |
15um Calibration 08/02/06: Spectrum (Left) and XY Graph (Right)
atmos/citation/cals/spp/home.txt · Last modified: 2020/01/29 17:25 by 127.0.0.1
