Table of Contents
Calibration of DMT CCN Counter
By: Alexa Otto
Edited: July 26, 2017
Setting up for Calibration
1. Perform a leak test on the CCNC by using a hand vacuum set to 10 psi. If leaks are present, check the entire instrument for loose screws and fix leaks appropriately.
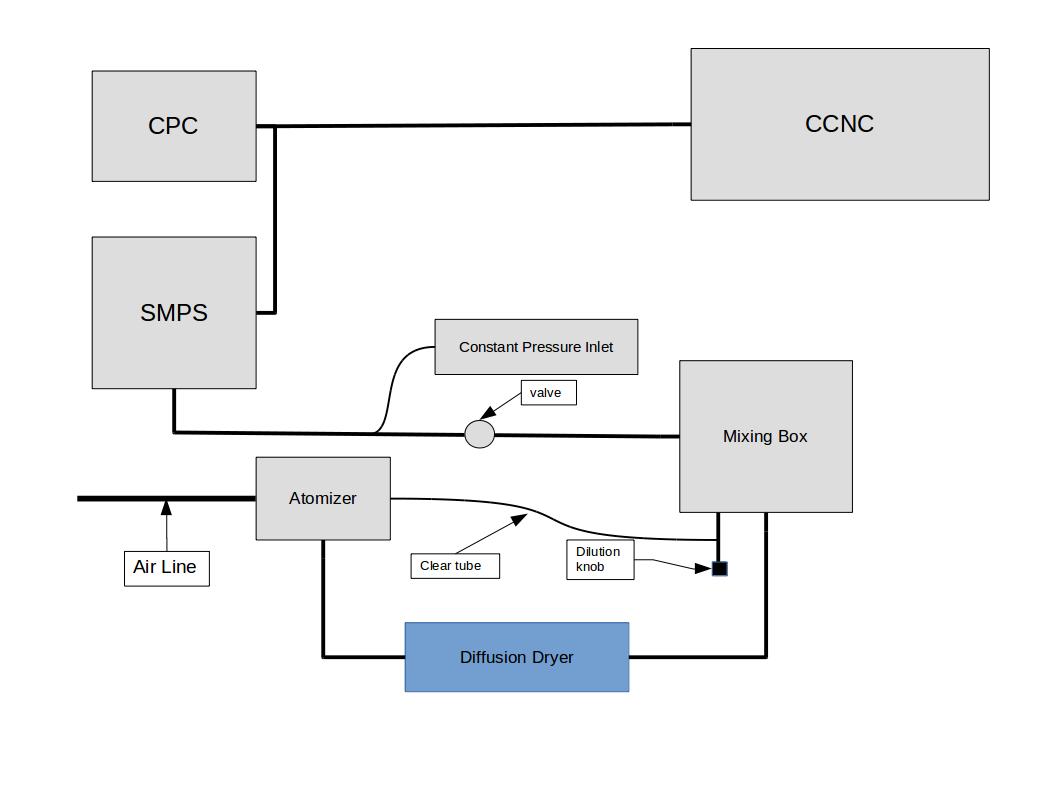
2. Connect the instruments as pictured below:
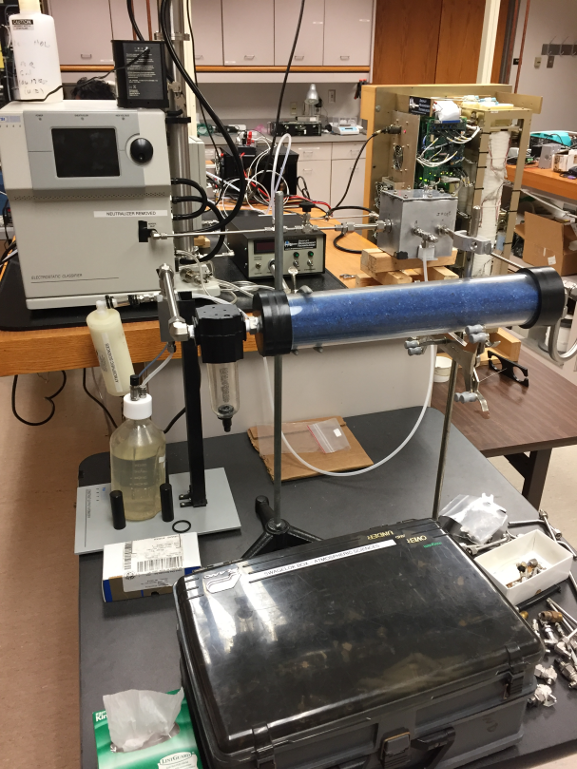
Here are pictures from the set-up in Clifford Hall 423
The picture above shows the atomizer, dryer, mixing box, SMPS, and constant pressure inlet.
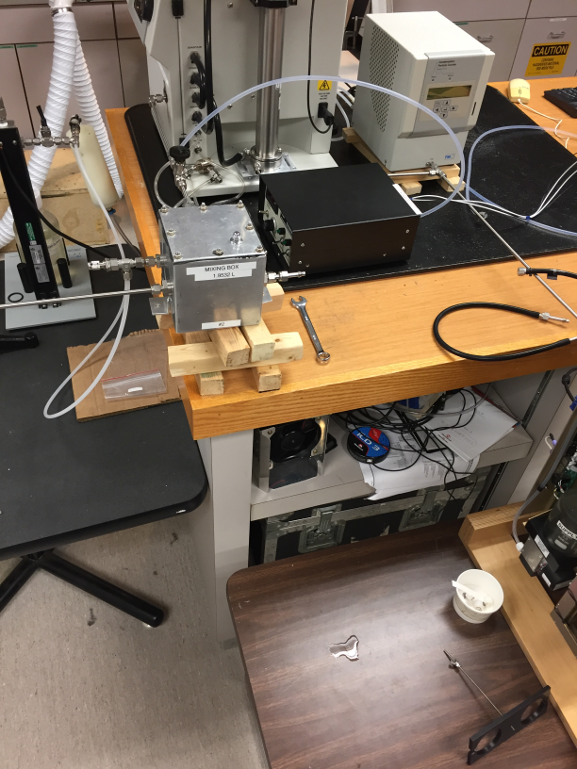
The above picture shows the connections between the mixing box, constant pressure inlet, SMPS (without impactor) and CPC (without butanol if calibrating at a lowered pressure).
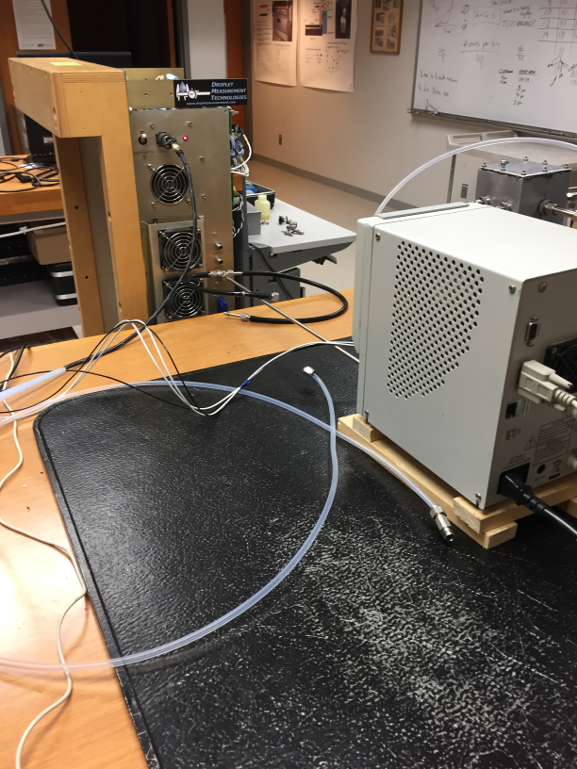
The above picture shows the connections between the CPC and the CCNC although all the connections are not there in this picture.
3. Turn on the vacuum connected to the back of the CPC.
4. Switch on the SMPS, Neutralizer, and CPC to let them warm up. The CPC takes 10 minutes to warm up.
5. Make sure that there is an open end on the mixing box to allow air flow through the system.
6. Turn on the CCNC which should be connected to a monitor.
7. Open the CCNC program. If you have the dual column counter you will open the dual counter program. If it is the single counter open the single counter 4.0.4 program.
8. Once the program opens, allow the timer to run down from 10 seconds before you click anything. After ten seconds the Super Saturation (SS) tab will switch to manual.
9. Navigate to the OPC tab and check the 1st stage monitor. This should read somewhere between 0.2 and 0.4 (usually below 0.2). If the monitor is above 0.4 and continues to stay above even after a few minutes follow these steps:
1. Proceed to the SS tab and set the ΔT to 0. Monitor the 1st stage monitor and if it does not start to go down, proceed to step 2.
2. Turn the liquid flow rate under the Flow tab to high and the liquid pump switch to off.Continue to monitor the 1st stage monitor. It could take 10-60 min for the 1st stage monitor to completely go down but you should start to see a bit of movement downward after 3-5 minutes.
3. If that still does not work, check all the lines coming from the OPC and if they are filled with water, turn off the instrument by clicking the Prog→ shutdown. Shut down the computer after the program has shut down before you shut off the instrument. Once the instrument is shut down, disconnect the tubing and drain the liquid from the tubing. You may also have to clean out the OPC Beam dump. Instructions can be found in the CCNC manual on the nas drive.
4. Once the 1st stage monitor has come back to its operating range, return the liquid flow rate to low and the liquid supply switch to on.
10. Under the SS tab, set the Δ T to whatever you would like to start at.
11. Allow 5- 10 minutes for the CCNC to reach that ΔT continuing to check the 1st stage monitor as well. Temperatures can be monitored under the temperature tab on the graphical window and the actual temperatures can be found under the temps tab in the textual window.
12. Connect the CPC to a CPC laptop with the AIMS program installed on it.
13. Open up the AIMS program and open a new file titled YYMMDD select the file type of .C^^ the arows indicate the last two digits of the model of the CPC (Ex. TSI 3772 is .C72).
14. Navigate to the view tab and click on instrument status. Check to see if there are any errors and that the CPC is functioning correctly.
15. Lower the atmospheric pressure slowly to the desired pressure carefully watching the CPC display to make sure you do not flood it. MAKE SURE THE BUTANOL IS DISCONNECTED! If the CPC floods, the particle counts will fluctuate rapidly. If flooding occurs, follow the instructions to dry out the CPC in the CPC manual on the nas drive.
16. Sync the times of the CPC computer and the CCNC counter under the control panel of the computers.
17. Once confirmation that all instruments are ready to go, you are now ready to start data collection. Make sure that you have a pencil, notebook, and calculator handy.
Data Collection
1. Set the sheath flow rate to 10:1 ratio on the SMPS. For example, if you have the single counter with a flow rate set to .5 L/min (pulls 0.5 L/min) and the CPC (pulls 1 L/min) set the sheath flow to 15 L/min. If you have the dual column counter, you will need to set it to 20 L/min as each column pulls 0.5 L/min if set at a flow rate of .5 L/min and the CPC pulls 1 L/min
2. Start the data collection of the CPC by hitting the green circle.
3. Determine what particle size you will start with and write that size down in your notebook. Starting particle sizes vary based on pressure and Δ T's. You should find a starting size that gives you a zero baseline (no particles become CCN) (For example, at a Δ T of 8 degrees C at 840mb the starting size was 30nm.)
4. Turn on the air compressor.
5. Once the air compressor is ready, note the time on the monitors, and set the SMPS to that size of particles using the display and turn knob on the front of the SMPS.The SMPS must gave the manual tab selected so that you can manually adjust any panel on the screen.
6. Carefully watch the CPC monitor and allow 2-3 minutes for the counts to stabilize.
7. Once the CPC counts have stabilized, record the time, the approximate counts on the CPC, and the ratio of CCNC to CPC. To do the ratio, estimate the concentration on the CCNC by looking at the graphical interface and dividing that number by the approximate CPC counts you just noted.
Format for Data Collection
<Particle Size> @ <Time>
Steady @ <Time> around <CPC count> ~ <Ratio Percent>
.
.
.
Particles Off @ <Time>
Notes for during data collection
- To get the ratio percent : (Average of CCN count for each column) / (Average CPC count)
- In order to see the CCN counts better you can manually click the y- axis on the screen and set to a number.
- In order to determine when the counts are maxed out on the dual column look for both of the lines to be very close together. On the single column look for three different sizes to have the same ratio.
- When you increase the ∆ T start to start a new round, set the particle size 5 nm lower than previous ∆T. (Usually 8 degrees C starts at 30nm to get zero point so if you go to 10 degrees then start around 25nm)
8. Allow 1 minute for the data to collect before stepping up the particle size on the SMPS by 5 nm and noting the time.
9. Continue steps 6-8 until you get three or four ratios that are the same (should be around 90-100%).
10. Once you have reached the top of the activation curve and allowed the last ratio to collect data for 1 min, note the time, and shut off the air compressor using the switch at the valve site and set the SMPS voltage to 0.
11. Next, under the SS tab, set the Δ T to your next value.
12. Once again, allow 5 minutes for the CCNC to warm up and then repeat steps 4-11 until all your Δ T's have been tested making sure to allow 5 minutes in between Δ T's to let the CCNC warm up.
Notes and Circumstances to Watch Out For
- Watch the CPC and try to keep particle counts around 1000 – 2000 #/ccm. If particles are higher dilute at the mixing box ½ to 1 full turn.
- Watch temperature changes on CCN monitor because it can skew the data. Sometimes this happens when the set temperature differences are not all the way to their set temperature and then spike to get to the set temp. Thus, check the temperature graph occasionally and the temperature differences before and during data collection.
- Watch Droplet size distribution:
- It should be narrow with a distinct peak and above zero. If it is too wide or below zero, the supersaturation is too low. As the ∆T's increase, the size distribution should be progressively more to the right without being bimodal. You should also not see any in the first bin on the graph at the higher ∆T's.
- If conducting calibrations at lower atmospheric pressures, the butonol can run out of the CPC. Watch the CPC data to check for this. If it gradually is falling and will not steady, the butonol is out and you need to bring the pressure up and replace the butonol before continuing data collection.
- On the CCN graph, spikes occur when changing sizes because the last size particles are still in the CCN and are activating in addition to the next size up.
After Data Collection
1. Once all data has been collected and the particles turned off, click the stop button on the CPC monitor and close the CCNC program by clicking Prog → Shutdown.
2. Insert a USB into the CPC computer. Under File, click export as text file with the time stamp and delimiter selected to comma.
2. Shut off the SMPS, CPC and vacuum.
3. Insert the USB into the CCN counter and using the monitor copy the files from the day of data collection onto the USB.
4. Once the data is copied from the CCN shutdown the computer and switch off the CCN counter.
5. Make sure all air flows are off.
Data Processing
1. Enter ssh -x citation2.atmos.und.edu (Will need a password for this site) in terminal
2. Under citation2 site: cd /nas/ral/NorthDakota/Year2017/DMT024_LabData
3. Make Directory: mkdir 2017<month ex. 06><day ex 15>_00000
4. Under the directory you just made make directories CPC_Data, DMT, DMTb, Intervals,
PostProcessing (For the single column you do not need the DMTb folder)
5. Copy the CPC data from the USB to the citation2 site: scp <year ex 17><month ex
06><day ex 15>.* (← CPC file name should be txt file) citation2.atmo.und.edu:<Path> Also, change the main directory name to have the same time stamp/name as the CPC data file.
6. Convert the CPC text files to NASA files: convert_cpc3771tonasa file= <text filename>
7. For dual column only: Make CCN data files just CCN data not CCN 200 data in file system on USB
8. Copy all CCN files to citation2 site under DMT
9. For dual column: open CCN files on USB and delete all of A so you are left with just B and save as
the same name as before but with b.csv at the end
10. Repeat step 9 for all CCN files from the run
11. Secure Copy all the modified CCN files to the citation2 site under DMTb
12. Process the data under the DMT file by entering the DMT file and using this command: process_day_dmtccnc <YYMMDD (ex. 170615)> This script processes the data into PostProcessing file.
13. For dual column only: mv PostProcessing/ PostProcessingA/
14. For dual column only: Make directory for data from DMTb: mkdir PostProcessing/
15. For dual column only: Process Data under DMTb after entering DMTb directory: process_day_dmtccnc <YYMMDD>
16. Enter into the Intervals directory
17. Make an interval file for the first ∆ T (Another NASA text file that is created from lab book documentation to define start and end times for dry particle sizes being selected in the DMA.)
18. Open file to make intervals: gedit 17_06_15_13_56_00.sizeintervals.raw (YY_MM_DD_HH_MM_SS.sizeintervals.raw)
19. Open new terminal and find a different interval file and copy the header information into the new interval file and change the date. The first set of dates is the date data was taken and second was the date the data was processed.
20. Start two spaces in and convert the time that the particle size was stabilized to seconds after midnight. ex. 52680.0000 (Use an online application to help)
21. Space over two spaces and convert the set time for the next size to seconds after midnight.
22. Space over four spaces and enter the particle size setting it was at. ex. 35.0000 (its already in nm)
23. Continue this process for all the size intervals
24. Save the file.
25. Enter PostProcessing/ or PostProcessingA/
26. Move the serial c file to a file name with the same label as the interval file you are going to process it with.YY_MM_DD_HH_MM_SS.serialc.dmtccnc.raw
27. Create a ccnccpcratio.raw file using this command:
python /usr/local/ADPAA/src/scripts_python/CCNCactivationsize.py PostProcessing(or PostProcessingA)/ <serial c filename> CPC_Data/<raw cpc filename> Intervals/<filename of interval file> PostProcessing/ <serial h filename>
The last command calculates the average counts and standard deviation of each instrument encompasssed by the time interval for each particle size. This script also calculates the activated ratio with a standard deviation for the sample at each time interval.
28. Move the serial c file again to a file name with the next interval file time label: YY_MM_DD_HH_MM_SS.serialc.dmtccnc.raw
29. Complete steps 27-28 until all the interval files has been processed.
30. The file generated by CCNCactivationsize is fed into the script sigmoidfit to create activation curves using the curve_fit fitting routine in SciPy 18.1. This script will output the activation size based on the half point between the maximum and minimum of the ratio data.
31. After all intervals have been processed, note the activation sizes of all the intervals in a notebook.
32. Put the activation size given by sigmoidfit into a text file along with instrument pressure and ΔT for supersaturation calculations.
33. Use the script SScal to calculate the supersaturation percentage based on the activation size using Kappa- Köhler theory. This script will also create the calibration line plots as well as an output file containing the standard deviations and calibration coefficients.
34. In the CCN details program insert the new calibration coefficients.


