atmos:citation:cals:cdp:home:cloud_droplet_probe
Table of Contents
Cloud droplet Probe (CDP) Performance Checks
Cloud Droplet Probe (CDP) Spinning Disk Perforamance Checks
Steps to use the spinning disk on the Cloud Droplet Probe (CDP).
- Place the spinning disk on the CDP.
- Start up the M300 data system and select the /test/cdp_dof_keep project.
- Select 'Open' under the 'Project'
- Move windows so you can see the counts in each channel.
- Adjust the position of the spinning disk until the number of counts in the higher channels increase.
- Getting 31 or 32 counts in 10-11 size was found not to be too difficult.
- The manual states that when things are aligned you should get counts in channel 20-22 um.
- Probably best to adjust the up/down and in/out axis first, and leave the along laser beam axis for the last.
This is should be the hardest since this moves the disk into the Depth of Field of the CDP.
- Once the best alignment is obtained, note the channel values.
- Close the project and open the /test/cdp_dof_reject project.
- This project is configured to reject out of the depth of field particles.
- Again align the disk to get the maximum counts in the highest channel.
- Once the best alignment is obtained, not the channel values.
- Save the M300 data files on the shared network drive.
Steps to obtain information from the CDP performance checks.
- Find the post processing directory within the day you want to review.
- This page will be referring to the date 07/13/11. The path to this post processing directory is /nas/und/NorthDakota/2011/Aircraft/CitationII_N555DS/GroundData/20110713_221202/PostProcessing
- Find the time, bead size, and which instrument the test was on.
- There is usually a readme file of some sort within the post processing directory. The times of each test should be found within this file.
- For 20110713_221202, the readme file has multiple tests. Do one test at a time.
- Note the time, bead size, and instrument. For this test the time is 22:19:40, bead size is 10um, and the test was on the CDP.
- For the CDP, the calibration checks take about a second or two. The intervals in this specific readme file are given, however, in other cases it may contain only the approximate time.
- In this file times are also already converted, however, if it does need to be converted from time to seconds to midnight use the time_convert program. To do this, in the terminal, run
time_convert.tcl
This opens a program that converts the time to seconds from midnight. Hence 22:19:40 converts to 80380.
- Find the correct counts file to open.
- Since we know what time we want, and what instrument to calibrate for, we find the file timed most similar which happens to be 11_07_13_22_12_02.counts.cdp.raw
- Open the counts file with cplot. In a terminal within the post processing directory, run
cplot 11_07_13_22_12_02.counts.cdp.raw
- Plot Time vs. Counts in a channel.
- X Axis → Time
- Y Axis → CDP_CH3
- Click on Plot → XY Graph
- Note: This gives you the counts in channel 3. There should be spikes in other channels also. Other channels should also be checked.
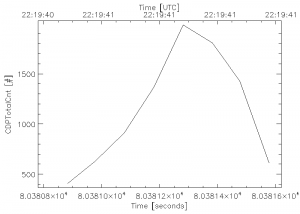
- Find the exact interval of the test using cplot.
- Pick an interval to look for the spike. The time given in the readme file converted to seconds from midnight is 80380. Since this is approximate, a peak should show up in the data between 80375-8035. To select this time interval, click on Control → Time Interval.
- After you enter a start time, you must press enter. Same with the end time.
- After the time interval is changed, replot the graph. Plot → XY Graph
- This should produce a graph that is zoomed in on a peak.
- Using the time interval feature, keep zooming in on the peak and find an exact start and end time for the peak.
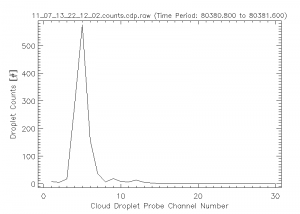
- Plot the spectrum and note the numbers from the plot. Do this by first clicking on Edit → Options → Display Text. Then click on Plot → Spectrum. This should display your plot of the spectrum and also the number of counts in each channel.
- Find the pre-peak, peak, and post-peak counts. Do this first by looking at the plot of the spectrum. Find the channel of the peak on the plot. In the example, the peak channel is channel 5. The values in the text window are the counts in each channel. In the example, the pre-peak counts are 351,peak counts are 676, and post-peak counts are 178.11.
- Calculate the Water Equivalent Size, Average Channel, and Standard Channel Size. Run the program avg_channel by entering into a terminal
avg_channel
The program will calculate Water Equivalent Size, Average Channel, and Standard Channel Size.
Example:
| Date | 07/13/11 |
|---|---|
| Start Time | 80380.8 sfm |
| End Time | 80381.6 sfm |
| Peak Channel | 5 |
| Mode | 0 |
| Size | 10.0 um |
| Water Equivalent Size | 8.88 |
| Average Channel | 4.850 |
| Standard Channel Size | 3.43 |
10um Calibration 07/13/11: Spectrum (Right) and XY Graph (Left)
Steps to perform CDP Calibration to get Threshold Tables values for the M300 Data System.
atmos/citation/cals/cdp/home/cloud_droplet_probe.txt · Last modified: 2020/01/29 17:25 by 127.0.0.1

