Table of Contents
Author: Daniel R. Adriaansen
Contact: daniel.adriaansen@und.edu
Last edit: 2008/12/08 06:17 UTC
Lower Atmosphere Wind Profiler (LAP)
- Manufacturer: Vaisala (Formerly Radian)
- Model Number: LAP-3000
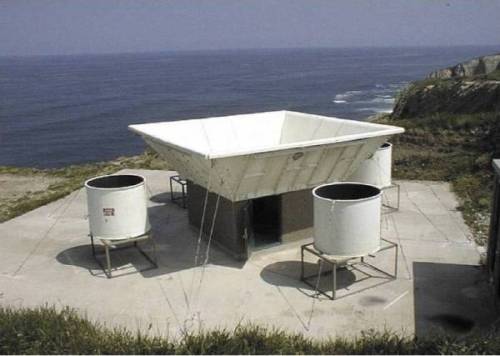
Figure 1. Coastal deployment of the LAP-3000 (shown with optional RASS) (Vaisala 2007).
1. Description
1.1 Design
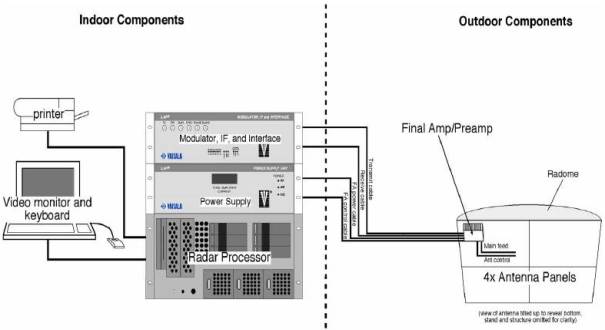
Figure 2. Components of the LAP-3000 (Vaisala 2007).
Signal path through the components:
- Modulator (Indoor) generates VHF intermediate frequency, typically 50 MHz, set by the controller.
- VHF signal transmitted to Final Amp/Preamp (Outdoor).
- Final Amp/Preamp translates signal to UHF 915 MHz.
- Antenna transmits signal, and waits for backscattered return.
- Returned power transmitted to Modulator (Indoor) where the 50 MHz returned pulse is mixed with a 50 MHz reference frequency for Doppler analysis.
Enhanced micropatch atenna view:
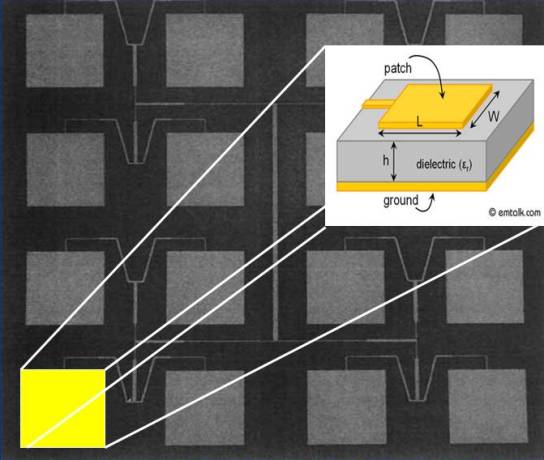
Figure 3. Micropatch antenna and schematic of a single patch (Adapted from Ecklund, Carter and Balsley 1988).
1.2 Specifications
| Operating Frequency | 915 MHz (United States) |
| Operating Wavelength | 32.8 cm |
| Minimum Measurement Height | 75-150 m (*) |
| Maximum Measurement Height | 2-5 km (*) |
| Range Resolution | 60,100,200,400 m |
| Wind Speed Accuracy | < 1 m/s |
| Wind Direction Accuracy | < 10 degrees |
| Transmitter Average/Peak Power | 100/600 W |
| Antenna | Micropatch (4) |
(*) These quantities are dependent on ground clutter and atmospheric conditions.
1.3 Cost
- Initial System Deployment (*)
- $351,000: Price includes tax, shipping, setup, training, and optional Radio Acoustic Sounding System (RASS)
- Calibration/Maintenence/Repair (*)
- $16,000 per year (Vaisala extended warranty)
- Additional Siting Costs
- Power
- Internet access
- Site security
- Concrete pad for antenna array
- Trailer/shelter for equipment
(*) Prices obtained from 2004 and 2006 South Coast Air Quality Management District budget reports (California):
2004 report
2006 report
2. Measurements
2.1 Measurement Physics
- Wind profiling is based on the concept of Bragg scattering (Rinehart 2004):
- Turbulence in the atmosphere creates temperature/humidity discontinuities.
- Temperature and humidity discontinuities create gradients in the atmospheric index of refraction.
- If the change in index of refraction is large compared to the wavelength of the wind profiler, backscattered energy is returned to the antenna.
- Rayleigh scattering can also result in backscattered energy
- Bragg scattering occurs for particle sizes up to ~ 0.1 mm in size (drizzle/light rain) (Williams, Eckland and Gage 1995).
- Rayleigh scattering dominates for particles larger than ~ 0.1 mm in size (Williams, Eckland and Gage 1995).
2.2 Measurement Methods
- Wind measurements are taken by the LAP-3000 using the Doppler Beam Swinging (DBS) technique.
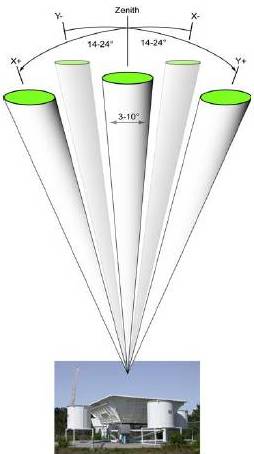
Figure 4. Schematic illustrating the Doppler Beam Swinging (DBS) technique (Vaisala 2007).
The following is a brief description of the DBS technique from (ARM TR-044):
- The DBS technique uses 5 beams: One zenith, and two off-zenith beams in the east-west (X) and north-south (Y) directions as shown in figure 4.
- It takes approximately 30-45 seconds (dwell time) to obtain the radial components from a single beam direction.
- Total sampling time for each beam on both high and low power mode is approximately 5 minutes.
- Consensus averaging is performed in the sample volume to determine if at least 50% of the values are within a specified range of one another (typically 1-2 m/s).
- If the values are within the range, average is taken to compute radial wind estimate.
- A time averaged wind profile is created by combining the radial values.
An example of a time averaged wind profile plot can be found at the NOAA CAP website: NOAA CAP
2.3 System Automation
The LAP-3000 is a stand-alone system. Once configuration is complete, continuous unattended operation is possible. Additional configuration can be made to allow remote access to the control computer. This reduces, but does not eliminate the need to travel directly to the profiler site. Due to the large amount of data generated by the profiler, local data archiving may be needed depending on the level of internet access at the site.
3. Data
3.1 Types
Since the LAP-3000 is essentially a vertically pointing radar, there are other data generated besides the time-averaged wind profiles.
- Raw Spectra:
- Energy in backscattered signal over all Doppler shifts observed in each beam direction and at each power level (ARM TR-044).
- Moments:
- Mean Doppler Shift
- Doppler width
- Noise Level
- Siginal-to-Noise Ratio )SNR)
3.2 Sources of Measurement Error
Ground Clutter
- Vaisala reccomends using the supplied clutter reduction screen with the LAP-3000. This is the highly visibly 'bucket' which sits over the antenna array:
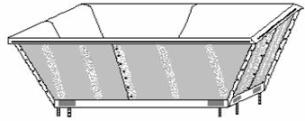
Figure 5. LAP-3000 clutter reduction screen (Vaisala 2007).
- This screen is effective for obstructions up to 20 degrees above the horizon.
Precipitation
- 915 MHz profilers exhibit an extreme sensitivity to hydrometeors (Ecklund, Carter and Balsley 1988).
Power Outages
3.3 Quality Control
The following are quality control measures performed at the ARM SGP site (ARM TR-044):
- Data flags (nearest neighbor comparison – gross errors).
- Radiosonde comparison over an identical height range.
- Comparison of high power mode 915 MHz data with 50 MHz low power data over an identical height range.
For additional quality control algorithms used with 915 MHz profiler data, see Lambert et al. (2003).
3.4 Quality Assurance
The following are quality assurance measures which can be performed on LAP-3000 data:
- Visual inspection of wind fields every 5 days.
- Time sections of averaged winds over 24-hr periods.
4. Calibration
4.1 Calibration Checks
The following are calibration procedures performed at the ARM SGP site (ARM TR-044):
- Measure power of final amp/preamp (Outdoor – see Section 1.1) and ensure it is 500 W.
- Center the transmit frequency to 915 MHz.
- Utilize software to determine the sign of the analyzed frequency difference for Doppler direction.
- Utilize a signal generator to create a dynamic range >= 55 dB.
- Measure system sensitivity by using a signal generator to create a minimum detectable level of -127 dBm.
- Utilize a delay line to verify range, +/- 30 m.
4.2 Performance Checks
Performance checks are basic, visual inspections which ensure normal operation. The following are taken from ARM TR-044:
- Check control lights
- Ensure data display is functional
- Verify date and time accuracy
- Monitor final amp current and make sure it is steady
- Check antenna rotation
- Inspect data appearance
- Ensure SNR levels are consistent
5. Siting and Installation
An example of an appropriate site location for the LAP-3000 is shown below:
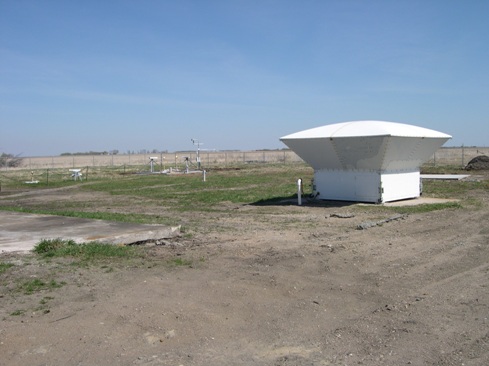 Figure 6. 915 MHz wind profiler at the University of North Dakota's Glacial Ridge Atmospheric Observatory.
5.1 Site Requirements
The California Environmental Protection Agency maintains several LAP-3000 to monitor air quality. Siting guidelines for the LAP-3000 were taken from their 1997 standard operating procedures. This document can be found here: CA EPA
- High speed internet access
- 220 VAC, 50 amp power supply (recommended)
- Vehicular access
- Concrete pad for antenna array
- Total site dimensions of 130 x 75 ft. desirable
- Fence
- FCC permit required due to the UHF 915 MHz operating frequency
5.2 Exposure requirements
The exposure requirements below were taken from the same document as Section 5.1:
- Limited radio frequency interference (microwave towers, telemetry lines)
- Obstructions less than 5 degrees above the horizon (limited ground clutter)
6. Deployment
6.1 Platforms
Nearly all of the LAP-3000 installations are at a fixed location. There are however installations on oil rigs, and mobile applications as well. One of the mobile deployments of an LAP-3000 is the University of Alabama Huntsville (UAH) Mobile Integrated Profiling System (MIPS).
Pictures and a description of the LAP-3000 on the MIPS can be found at the UAH website: MIPS LAP-3000
6.2 Field Projects
- Bow Echo and Mesoscale Convective Vortex Experiment (BAMEX) -2003-
- UAH MIPS LAP-3000 deployed on multiple observation days
Example of data taken with the LAP-3000 during BAMEX:
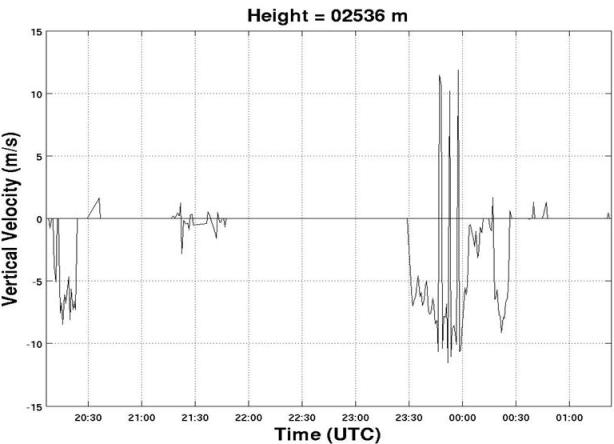 Figure 7. Vertical velocity data from the UAH MIPS deployment on 28 May, 2003.
7. Resources
7.1 Documentation
- ARM 915 MHz wind profiler manual (ARM TR-044): ARM TR-044
- Vaisala LAP-3000 Brocure: LAP-3000 Brochure
- Vaisala LAP-3000 informational presentation: LAP-3000 Presentation
- California EPA 1997 Standard Operating Procedure for LAP-3000: CA EPA
- South Coast Air Quality Management District 2006 budget report: AQMD
- South Coast Air Quality Management District 2004 budget report: AQMD
- UAH MIPS LAP-3000 MIPS LAP-3000
- Additional information about Micropatch antenna physics: Micropatch Physics
7.2 References
Ecklund, W. L., Carter, D. A., and Balsley, B. B., 1988: A UHF Wind Profiler for the Boundary layer: Brief Description and Initial Results. J. Atmos. Oceanic Technol., 5, 432-441.
Lambert, W.C., F.J. Merceret, G.E. Taylor, and J.G. Ward, 2003: Performance of Five 915-MHz Wind Profilers and an Associated Automated Quality Control Algorithm in an Operational Environment. J. Atmos. Oceanic Technol., 20, 1488–1495.
Rinehart, R.E., 2004: Radar for Meteorologists. 4th ed. Rinehart, 482 pp.
Williams, C. R., Ecklund, W. L., and Gage, K. S., 1995: Classification of Precipitating Clouds in the Tropics Using 915-MHz Wind Profilers. J. Atmos. Oceanic Technol., 12, 996-1012.