Table of Contents
Joss-Waldvogel Disdrometer
Description
Cost
- Purchase:
- Sensor: ~ $5,000.00
- Processor: ~ $7,000.00
- Maintenance/Repair: Maintenance is on the order of $100s to low $1000s; Repair work is usually quoted for price, depending on the ammount of repair work.
- Calibration: Calibration costs are minimal when completed by the owner. If need calibration from Distromet, LTD., costs are estimated on the order of a few hundred dollars.
Measurement Physics
General Setup:
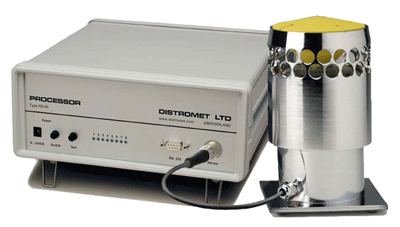
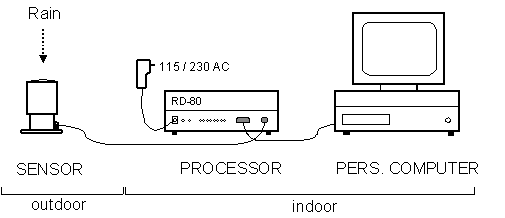
- The disdrometer contains two units: the sensor, which gets exposed to rain drops and the processor, which is used for analog processing and digitizing of the signal sent from the sensor. These two units are connected by a 20 meter cable, which allows for the processor to be stored inside.
Summary of Process:
- The disdrometer takes the vertical momentum of a drop hitting the surface of the top of the rubber membrane and converts it into an electric pulse with amplitude as a function of drop diameter. Analyzing the pulse height will give different size distributions of the rain drops. The processor will divide the pulses into 127 different classes of diameters, where every drop that hits the sensor will transmit a seven bit ASCII code to the PC. There is a software program with the processor that will be used to make this into a desired format that is easier to work with to get the data. For easier viewing of the data, the software reduces the number of cases into 20 broader classes of diameter.
Specific Instrument Description:
- The amplitude of the electric pulse is also proportional to the mechanical momentum of the drop. The sensor transforms this momentum into the electric pulse. The sensor’s working parts are protected by a cylindrical case so that it will not be ruined by outside elements.
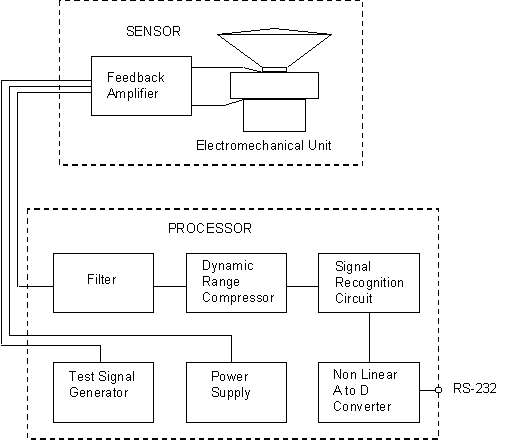
- The sensing unit contains two main parts, which are a feed-back amplifier and an electromechanical part. A styrofoam body is used to transmit the impulse of a drop to two coil systems in a magnetic field. These two systems working together induce a voltage that gets amplified and gets applied a controlling coil. There is little return time as to allow for many drops to hit without interference. The pulse that is amplified is used to measure the size of the drop.
- The processor helps get rid of undesired signals, due to noise, to lower the 90 dB dynamic range of the sensor signal and to help transform it into seven bit code through digitization.
- A schematic drawing shows all the different parts associated with retreiving and processing the information.
Performance Characteristics
Field Projects
TI1 Building site, College Station, TX
- Site developed and maintained by Texas A&M University
- The J-W Disdrometer was placed and maintained at this site under the supervision of Dr. Courtney Schumacher, who also took the photographs shown below.
- Two more J-W Disdrometers are currently being installed in Houston, TX and Galveston, TX.
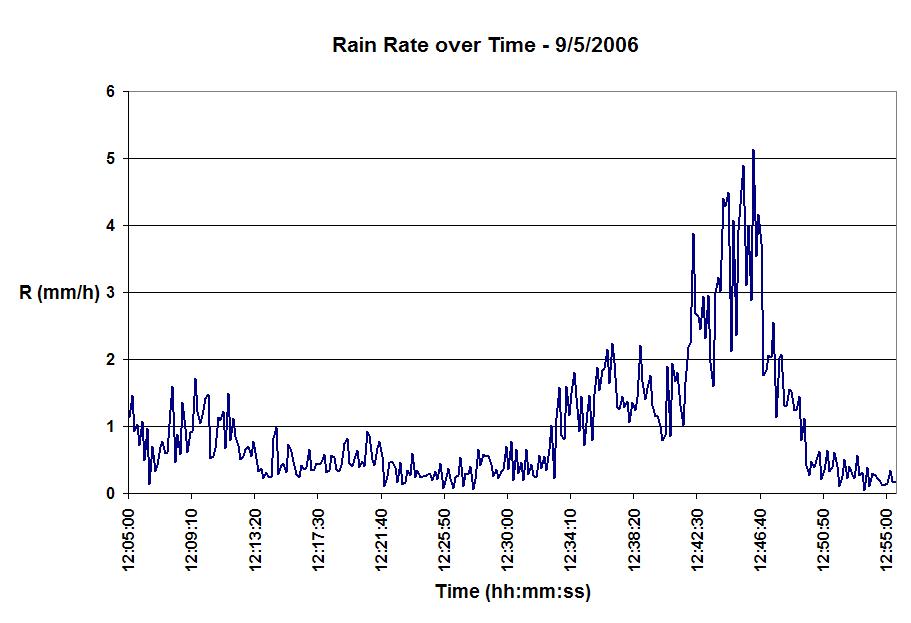
- Local rain rates were calculated from the data that was recorded by the disdrometer.
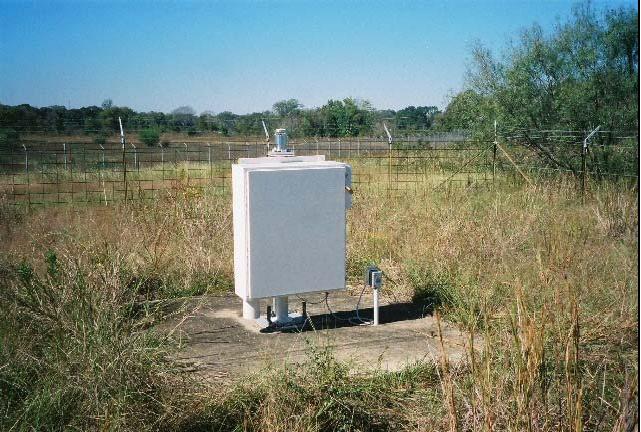
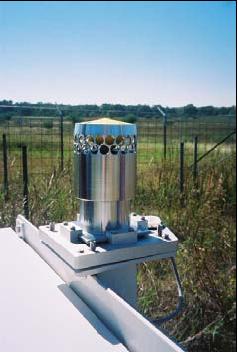
- Below are a couple of pictures of the field site:
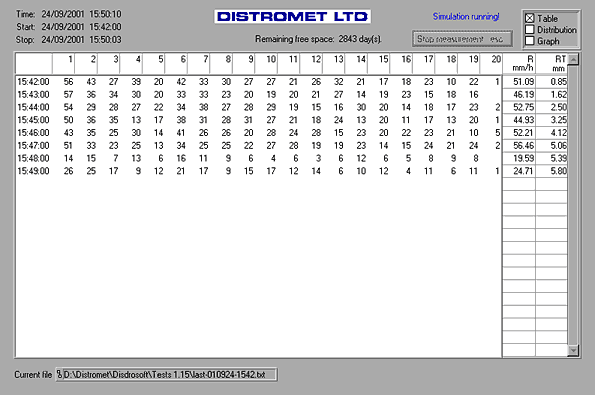
- Here is an image of the data display platform:
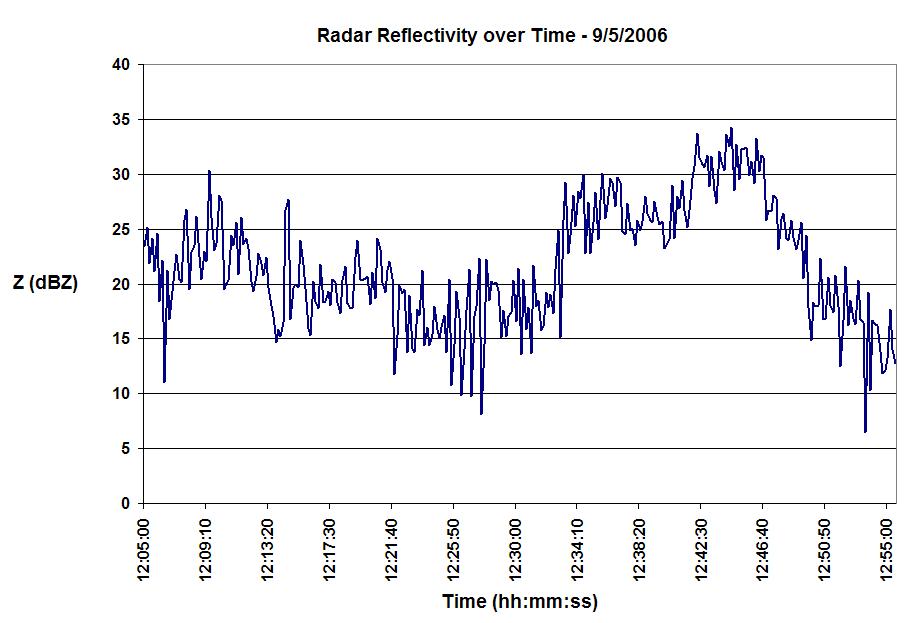
- And here are some figures of some data that was taken by Karen Brugman at the field site in College Station on September 9, 2006. The figures were created by me from the data that Karen collected.
Documentation
Here is a link to the papers used in development of the disdrometer
Reference
http://www.distromet.com (The left menu has a link to all the references used with the website and instrument)
Lawrence D. Carey, Ph.D. - Assistant Professor, Texas A&M University
Courtney Schumacher, Ph.D. - Assistant Professor, Texas A&M University
Calibration
Method
There are a couple of ways to calibrate the disdrometer, one of which is to calibrate the whole system while the other is to calibrate individual parts. It was discovered that the latter method was much easier to perform, so this method is the calibration discussed.
Disdrometer Sensor:
- When using drops of approximately 0.8mm diameter at near terminal velocity, vt, the sensor can be calibrated. I am not sure how these drops are created, but there is obvioulsy some sort of control that produces drops of this size. These drops should evenly be distributed over the surface of the sensor, and if the error in diameter is greater than about 3%, the gain value in the amplifier in the sensor must be corrected. This process should be repeated until this error is no longer seen. Usually recalibration of the sensor is not needed due to its good stability, but if the mechanical parts are disturbed, the calibration could be disrupted.
Disdrometer Processor:
- The processor’s job is to reduce the dynamic range of the sensor so that the data can be processed by the analyzer. For the model of disdrometer that is being addressed here, the analyzer is part of the processor. To calibrate the processor, a separate instrument is utilized to adjust some potentiometers of the circuit. This helps check the slope of the characteristic at 31 points using electric pulses of similar form to those of the sensor. All of the processors come with a table that lists the characteristics. Another way to check the characteristic of the slope is to press the test signal button on the processor, looking at the LED screen to show Nr.4. It is important for the processor to be connected to the sensor for this method. Just like the sensor, there should be no need for recalibration due to good stability of the processor.
Sources of Error
- Location of the drop has an effect on the amplitude that is measured. If a drop somehow hits the edge of the instrument, the full value of the drop will not be recorded, and errors will be associated with the drop.
- Since the calibration is performed in the lab with known drop sizes, very large drops can produce some errors. It is suggested by the manufacturer to check this by using a calibrated rain guage. From this process, errors can be as great as 15%.
- Physical wear on the instrument from being exposed to water can eventually cause errors, but these are not large errors.
- When used in an outdoor setting, other elements of the weather can effect the flight of a raindrop, causing situations like the drop hitting the edge of the sensor. Trying to avoid placing the sensor in locations where this would be a large factor would greatly reduce the amount of error.
Exposure Requirements
- In order for the disdrometer to get the best data, it must be exposed to precipitation such that the wind and/or other elements do not play a large role in how the drops hit the sensor.
- This instrument is designed for outdoor use and can therefore be left outside as long as desired. It would likely be a good idea to check on the instrument during field campaigns to know if it is still performing correctly. This task should be completed often to ensure the best data is collected.
Deployment
Measurement Methods
- The versatility of this instrument is good since it can be used for different purposes.
- The main use, though, is for meteorological applications that produce some kind of signal on the disdrometer.
- However, there is still one main measurement method, and that was explained above in the Measurement Physics section.
Deployment Platforms
- The disdrometer can be deployed in pretty much any environment, and the purpose of the project determines where deployment will be.
- This disdrometer can be used to determine the following:
- Use of determining drop size in radar applications
- Precipitation physics, such as rain rate
- Microwave physics, due to the accoustic nature of the instrument
- Soil erosion
- From the list of applications, the platforms can be located in such places:
- Near a radar to combine data from reflectivity values and drop sizes
- Any place where precipiation would be easy to record
- Locations near a microwave emitting source, probably another instrument
Communication
- The sensor cable communicates with the processor by transferring the pulse signal so it can be converted and digitized.
- The processor communicates with the personal computer through an RS-232 connection, which allows for the digitized information to be read by the provided software program.
- One note about the sensor cable is that if a longer cable is desired, the sensitivity will be decreased. For example, a 100 m cable would have a decreased sensitivity of about 0.5% of drop diameter, showing that the communication is harder to maintain over longer distances.
- Although it would be nice to have simultaneous communication with more than one instrument, this instrument does not have this type of versatility.
Power and Installation
- It is important to take precautions when installing the disdrometer. Quiet surroundings should be found because high noise levels can give greater errors to drop measurements. This could cause the removal of the drop signal along with removal of the noise, which is not desired. This is especially troublesome for measuring smaller droplets. Winds have been observed to produce a similar effect so installing the sensor so the top is level with the surroundings would help reduce this.
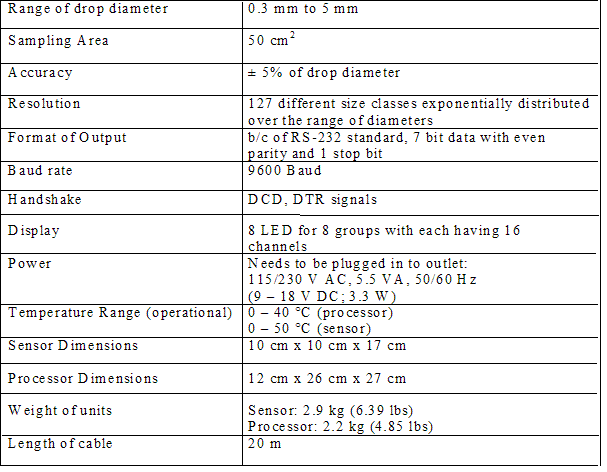
- The list of power requirements appears in the table above, but there is a provided power cord that works with a standard 115V AC outlet. It is important that the processor is located within a reasonable difference to an outlet.
Data
Quality Control
- There are several ways to ensure the quality of the data:
- Measurements are made continuously throughout an event and new information is stored in the 'current data' file, but copies of each of these are made so that no data gets lost
- UPS power also helps so that data will not be lost
- Screensavers interrupt the acquisition of data and should not be used
Quality Assurance
- Assurance of the data is important, so the following are very helpful with ensuring the quality assurance:
- DISDRODATA, the provided software, should be used for all analysis and acquisition because if other software programs are used, the amount of data that can be viewed would be reduced
- Using other software programs also creates a less stable environment, making it easier for the data to be lost or analyzed incorrectly
- Since all disdrometers have been precalibrated in a lab, this should provide some assurance. If it is felt that another calibration is needed, the procedures from above can be completed.
