Table of Contents
2D Optical Array Spectrometer Probe
Description
Cost
- Purchase: ~US $10,000: 2D-C/2D-P; US $130,000: 2D-S (Stereo)
- Maintenance: Not much routine maintenance needed. Optical cleaning and laser alignment check could be done by manufacture, cost depends on the company.
- Calibration: Can be done with latex beads or spinning disc with etched holes, cost is minimum.
Measurement Physics
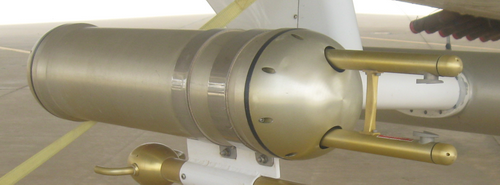
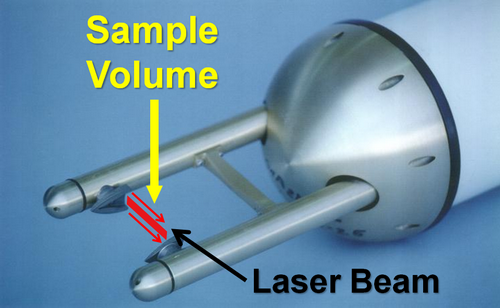
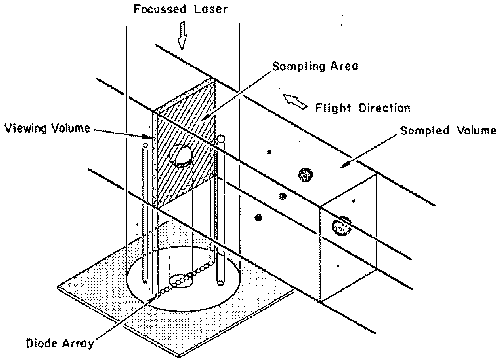
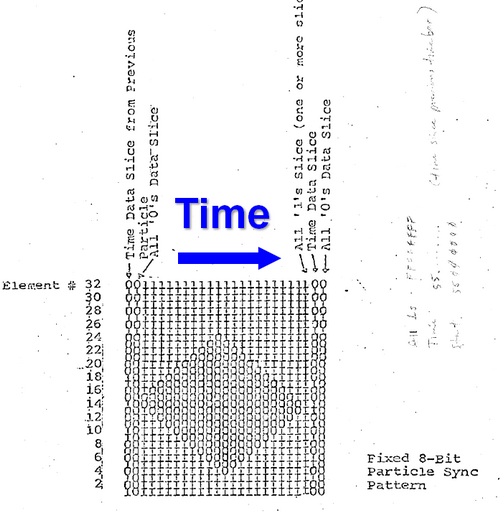
The 2D probe uses a focused He-Ne laser beam unit in its optical array. The laser beam exiting from one of the two arms extending from the PMS tube and enters the other arm (see Fig.1, the two blue triangular parts). As the hydrometeors pass through the Depth of Field (DOF) of the laser beam (the center of the area between the two arms), they block the laser from reaching the linear photodiode array, thus casting a shadow on the diode (see Fig. 2). The shadow state of each of the photodiode is stored each time the probe moves the distance of one array width during the particle’s passage through the laser beam (Fig. 3). This information, along with the time that has passed since the previous particle, is recorded in the data system for post-flight analysis. The image slices can be restored later to form a reconstructed two-dimensional image of each particle. The shape and size of the particles are thus obtained through the reconstruction process. Some information needed for the composition of the particle may be deduced from the shape and from other information such as the temperature, liquid water content, or altitude at which the measurement is made.
Figure 1. Two arms extending from the PMS tube, the laser beam pass through the center where the measuring volume is.
Figure 2. Schematic of 2D Optical Array Probe.
The 2D probe also sends a “Shadow-Or” count to the data system, which is generated every time a particle passes through the laser. The image data are stored by the data system asynchronously, which is different from the synchronous data from other aircraft sensors, and thus required separate processing.
Figure 3. Shadow data format sample.
Performance Characteristics
Field projects
- Mixed-Phase Arctic Cloud Experiment (M-PACE) during Sep 27 – Oct 22, 2004 at Barrow, Alaska
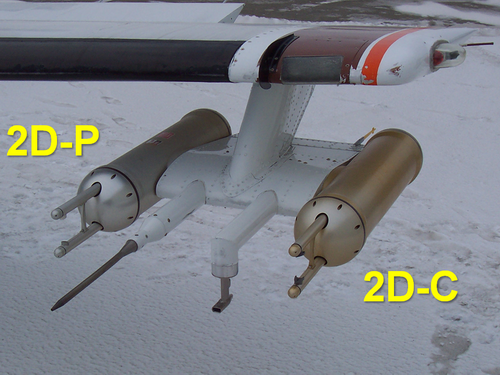
- 2D-C, 2D-P were onboard UND Citation Aircraft
- Used to measure cloud and ice-crystals sizes and number concentrations in Arctic mixed-phase cloud
- Pictures courtesy of Hans Verlinde (Fig. 4)
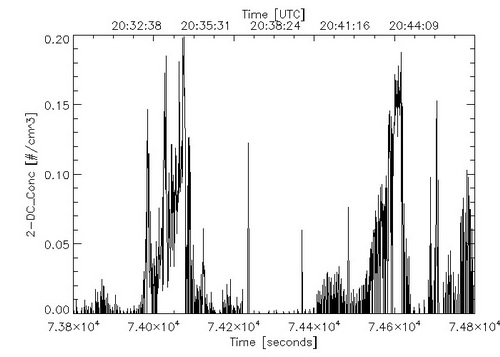
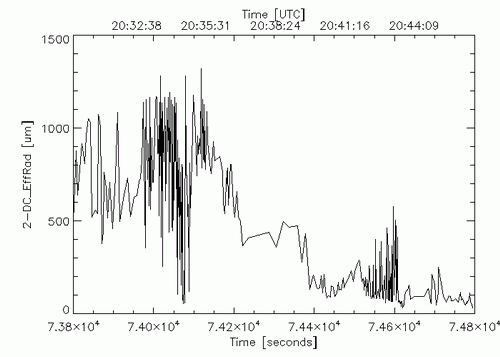
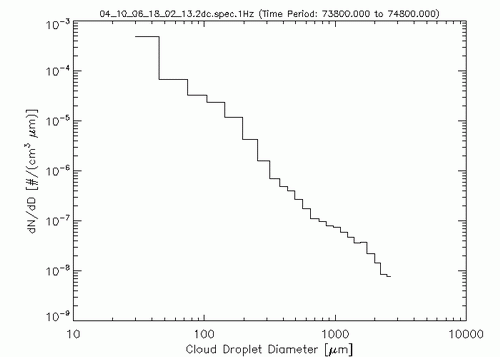
- Figures of data recorded from the 2D-C probe on the UND Citation Aircraft on Oct 6, 2004 at Barrow, Alaska. Figure 5 shows the images recorded from the 2D-C probe of various shapes of ice crystals. Figure 6 shows the derived number concentration, particle effective radius and drop size distribution during a certain flight period.
Figure 5. Shadow images recorded from the 2D-C probe during M-PACE.
Figure 6. 2D-C number concentration (top), particle effective radius (middle), and drop size distribution (bottom).
Documentation
Here is a link to some description of the 2D probe from NCAR: http://www.eol.ucar.edu/raf/Bulletins/bulletin24.html.
Reference
Knollenberg, R.G., 1970: The Optical Array: An Alternative to Scattering or Extinction for Airborne Particle Size Determination. J. Appl. Meteor., 9, 86–103.
Lawson, R.P., D. O’Connor, P. Zmarzly, K. Weaver, B. Baker, Q. Mo, and H. Jonsson, 2006: The 2D-S (Stereo) Probe: Design and Preliminary Tests of a New Airborne, High-Speed, High-Resolution Particle Imaging Probe. J. Atmos. Oceanic Technol., 23, 1462–1477.
Strapp, J.W., F. Albers, A. Reuter, A.V. Korolev, U. Maixner, E. Rashke, and Z. Vukovic, 2001: Laboratory Measurements of the Response of a PMS OAP-2DC. J. Atmos. Oceanic Technol., 18, 1150–1170.
Calibration
Method
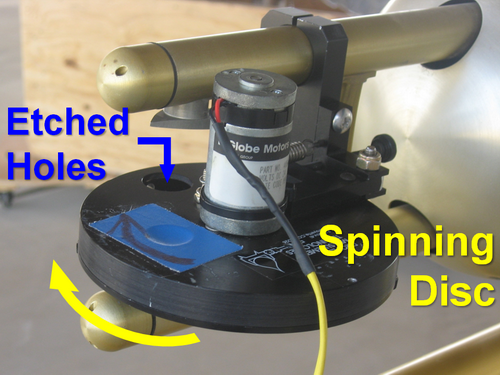
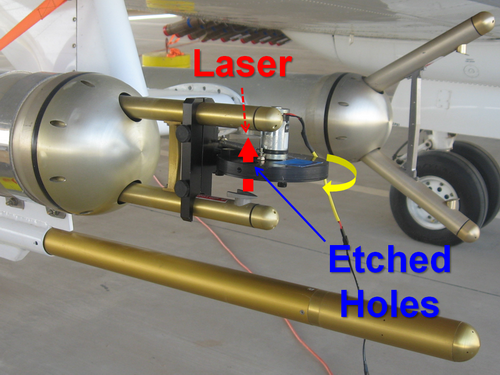
A spinning disc with etched dots is typically used to calibrate the 2D probe (see Fig. 7). A motor that drives the disc is attached to the 2D probe for the calibration. The disc has several known sized etched holes which allow the laser beams of the 2D probe passing through while it is spinning. By providing the speed of the motor driving the spinning disc, the shadow area and counts of the etched holes can be measured and calibrated for the 2D probe. If well calibrated, the spectrum of the etched holes measured by the 2D probe should only have distinct peaks at the channels matching the sizes of the holes.
Figure 7. A motor driven spinning disc with etched holes is used for the 2D probe calibration.
Sources of Error
Particles passing outside the optical depth of field (DOF) can result in large counting and sizing errors. The probe’s sensitive DOF significantly decrease with particle velocity, particularly for small size particles. Thus measurement accuracy decreases for small particles due to the small DOF (more small particles will be out-of-focus).
Additional errors occur due to the relatively slow time response of the imaging probes. The time response of the 2D-C is limited by the time constant of the photodiode array and first-stage amplifier, leading to a significant reduction in sensitivity to particles with sizes <~100 μm at airspeeds of 120 m/s and greater.
Exposure Requirements
The 2D probe is usually mounted on the PMS tube underneath of tip of the aircraft wing, so that the air flow effect of the aircraft body is minimized (see Installation below).
Deployment
Measurement Methods
The main measuring physics is discussed in the previous section. Note that during the 2D probe measurement, the speed of the aircraft must be fed to the 2D probe such that proper recording intervals can be set to match the speed of the particles passing through the probe.
Power and Installations
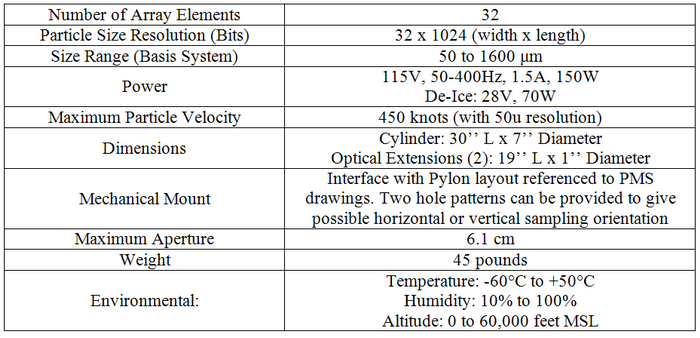
- Power requirement: 115V, 50-400Hz, 1.5A, 150W; De-Ice: 28V, 70W
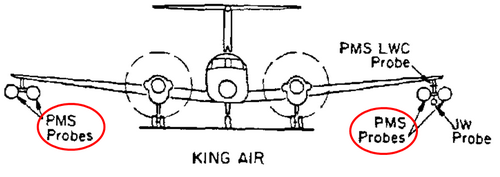
- Installation: the 2D probe fits in the PMS tubes which is usually mounted underneath the tip of the aircraft wing (see Fig. 8). It required a 2D interface card, and the M300 data system to record data.
Figure 8. Locationos of the PMS probes on an aircraft.
System Automation
Once turned on, the 2D probe automatically records data onto the M300 system when sizable particles are encountered. Since it is an asynchronous system, it only records data when there are particles causing measurable shadows to the photodiodes.
Data
Quality Assurance
The 2D probe captures the shadow image of particles as the pass across the linear array of diodes. Some of these images do not truly represent the real particles in the atmosphere but are results of splashing or breakup of water or ice on the probe arm tips. In especially high concentrations of raindrops, liquid water content, or graupel, a serious bias in the derived size distributions and concentrations could result from a high rate of the generated spurious images. Therefore, a few spurious image rejection techniques are be used in processing the 2D probe data. Each of these techniques is briefly discussed below.
- Short Arrival Time Rejection
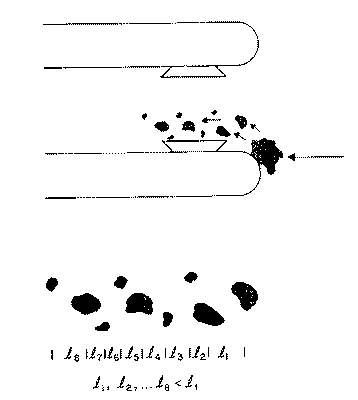
If the spacing between each measured particles is smaller than the threshold distance (see Fig. 9), which can be determined by the average concentration of cloud particles, the particles are then rejected as spurious particles. If the threshold is specified to be much smaller than the average expected spacing between particles, the majority of spurious particles generated by collisions with the probe tips will be rejected. The fraction of legitimate particles being erroneously eliminated can be calculated if the particles are assumed to be distributed randomly in space with an exponential distribution function:

where l = distance between particles, lt = threshold distance.
Figure 9. Example of spurious particles generated by the breakup of a large particle on the probe tip.
- Hollow and Gapped Particle Rejection
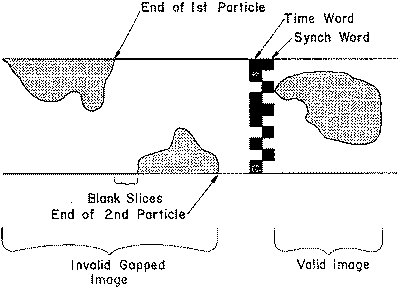
Spurious particles from arm tip collision sometimes create images that look like a number of distinct particles in the same image frame. The particles are rejected if the following two conditions are detected in the analysis:
- When several blank image slices occur within the image (see Fig. 10)
Figure 10. Example of a gapped image.
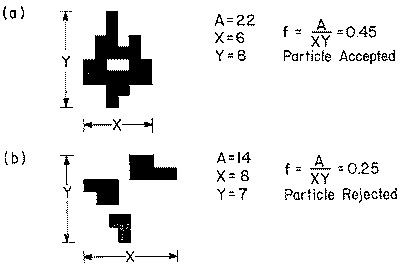
- The ratio of the shadow image to the area of the rectangle enclosing the image is less than a preset threshold. The fraction (shown in Fig. 11) is determined by:
where A is the image area expressed in number of diodes shadowed and X and Italic TextY are the lengths of the slides of the rectangle that contain the image. The lengths are also expressed in number of diodes.
Figure 11. Schematic representation of the algorithm used for rejecting hollow particles.
- Water Streamer Rejection
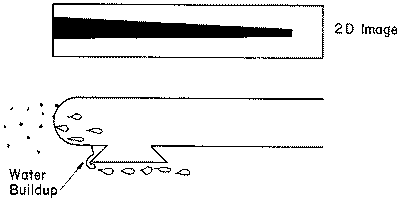
In conditions of heavy liquid water content, water could build up on the splashguards of the probe and eventually be discharged across the sample volume and appears as an elongated image (see Fig. 12). These images are rejected if the length along the direction of flight is six times greater than the width along the diode array. These “streaker” rejected criteria could sometimes reject larger particles or particles only partially in the sample volume. Extra constraints are applied when the width of the particle is greater than 3/4 of the array width, or if any of the diode array end elements are shadowed, then the rejection criteria is not imposed.
Figure 12. A typical “streaker” image.
- Blank Image Rejection
If the 2D probe register the occurrence of a particle, but the resulting image is blank, the “zero area” image is usually a result of the particle size being of the same order as the resolution of the probe. When a particle enters the laser beam, the 2D probe starts recording at that moment, and then waits until the next cycle of timing clock (which is called the “true air speed clock”, since the frequency of timing is proportional to the aircraft velocity). If the particle is very small, it will passed the laser beam array completely by the time next clock cycle occurs. Therefore, the diodes does not capture any shadow in time, but the event is still recorded by the probe. Most of these “zero area” events are caused by legitimate particles and could be used in the calculation of the total concentration. However, the decision is left to the investigator to determine whether or not to reject these events in the analysis.
New Frontier: 2D-S (Stereo) Probe
Design
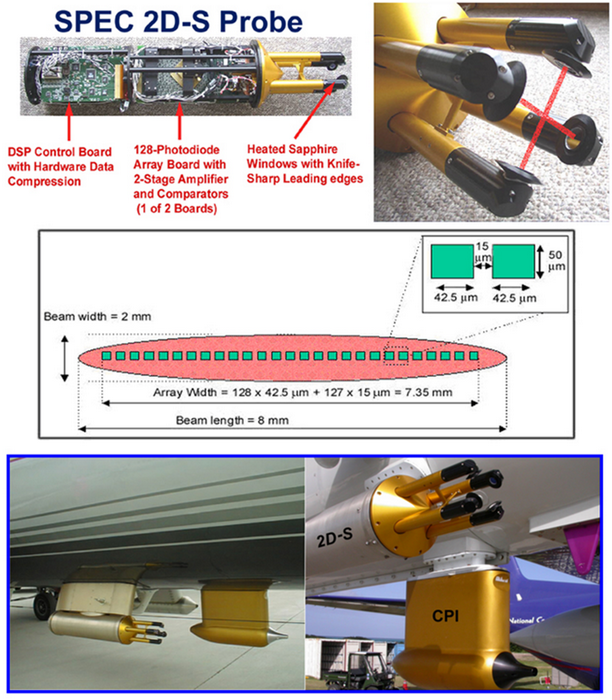
The two-dimensional stereo (2D-S) probe is designed to minimize errors associated with DOF, sample volume uncertainties, and time response of the old 2D probe. It has two diode laser beams crossing at right angles and illuminating two linear 128-photodiode arrays (see Fig. 13). The orientation of the two channels can be position at any angle by rotating the probe. The overlap region defined by the two laser beams improves the sample volume boundaries and sizing of small (<~100 μm) particles, compared to conventional 2D probes. The effective pixel size is about 10 μm for each channel, resulting in a sample cross section for each optical path of 0.128 cm x 6.3 cm = 0.8 cm2, where 0.128 cm is the number of photodiodes times the pixel spacing and 6.2 cm is the distance between the arms of the probe. At 100 m s-1 airspeed, this results in a total sample volume of 16 L s-1, which is about 3.3 times the sample volume of the PMS 2D-C probe, and equal to the sample volume of the Droplet Measurement Technologies (DMT) Cloud Particle Imager (CPI) probe.
Figure 13. Photographs showing (top left) some principle features of the 2D-S probe, (top right) a close up of the sample region with crossed laser beams, (middle) a drawing showing the geometry of the linear 128-photodiode array where the shaded oval area represents the laser beam, and (bottom) photographs of the 2D-S probe installed on (lower left) the SPEC Learjet and (lower right) NCAR C-130 (Figure taken from Lawson et al. 2006).
Advantage and Future Development
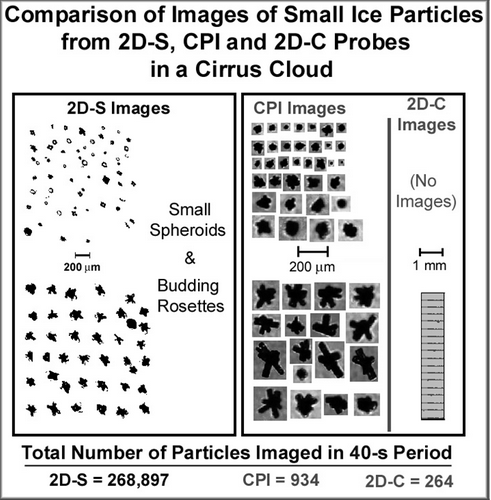
Field experiment of 2D-S on research aircraft flights into various clouds suggest that the 2D-S can measure particles from 10-30 μm diameter cloud drops up to several hundreds of microns ice crystals in the same field of view. The 2D-S records thousands of particles smaller than ~150 μm when the 2D-C sees a few or none (e.g. see Fig. 14). The shapes of ice particles observed by the 2D-S probe agree well with the Cloud Particle Imager. Overall, the comparison of 2D-S probe with other imaging probes suggests many advantages of the 2D-S. However, further development is needed to handle out-of-focus images, eliminate edge diffraction of out-of-focus particles, and develop reliable automated software to reconstruct stereo particles as well as three-dimensional shape from two stereo views of a particle.
Figure 14. Examples of images from the 2D-S, Cloud Particle Imager and 2D-C probes in a cirrus cloud (-45 °C) investigated by the SPEC Learjet (Figure taken from Lawson et al. 2006).
