Measured Atmospheric Change in Lead Particulate Matter from UL94 Fuel Switch by Major Aerospace College
David Delene, Alex Mendez, ….
* Grand Forks, Grand Forks International Airport Observed Weather
BACKGROUND:
Lead(Pb):
- Lead(Pb) is a soft,dense naturally occurring metal that is found in Earth's crust.
- Lead is highly toxic to human's and animal's health. (potent nuerotoxin)
- Lead is found in the air, water, soil, and in all parts of the environment.
- Most exposure to Lead is due to human activities such as the use of Leaded products like leaded fuel, paint, cosmetics, batteries, etc…
- In addition, Lead is exposed to the environment from industries and contaminated sites(Ex: Lead Smelters).
- These sources of exposure are expensive to fix/remediate, and politics surrounding this issue remains at a stalemate. Suggesting Lead poisoning will continue to be a factor in the future.
- The most concern is around children who experience symptoms of Lead poisoning at lower levels compared to adults.
- Adults symptoms often go away as lead exposure becomes stopped. Children on the other hand will develop problems from the continuous exposure and may never recover even if exposure is ceased.
- From a spark-ignition engine aircraft, lead will be released and travel far distances before settling to the ground and sticking to soil particles and possibly move into ground water depending on the type of lead compound and characteristics of the soil.
- Due to lead’s environmental impacts, the unleaded gasoline transition started in the 1970s with new vehicles engineered to run on unleaded gasoline, and by the mid-1980s most gasoline used in the United States was unleaded. A similar transition is now occurring in general aviation (Kessler 2013.
- Federal laws and regulations have been placed to reduce lead exposure.
Sources:
Lead Exposure Data:
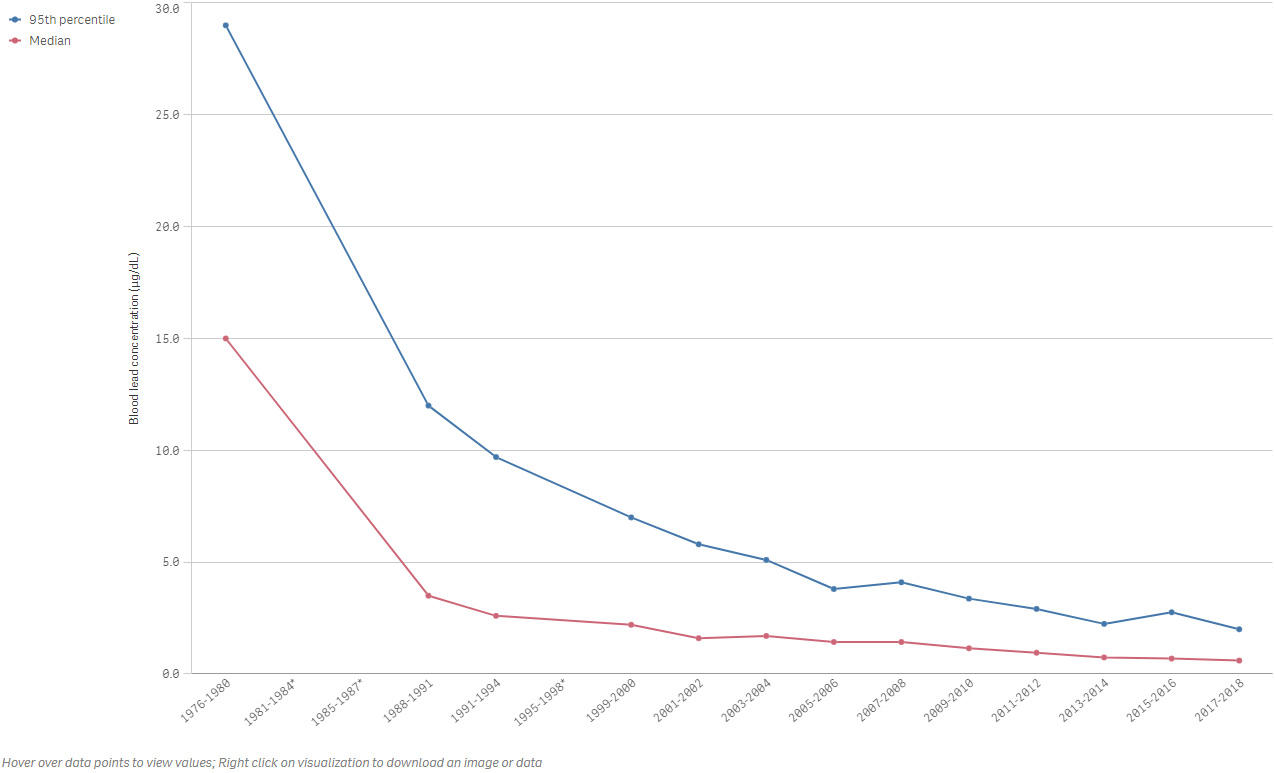
 Figure 1.Lead Concentrations in blood in children ages 1-5: Median and 95th percentile. Lead concentration has significantly decreased throughout the years. Still, children continue to be exposed to lead due to human activities such as the use of Leaded commercial aviation fuel. Figure provided by America's Children and the Environment (ACE)(https://www.epa.gov/americaschildrenenvironment/biomonitoring-lead.
Health Effects of Lead:
- Children:
- Behavior and learning problems
- Lower IQ and hyperactivity
- Slowed growth
- Hearing Problems
- Anemia
-Pregnant women:
- As lead accumulates in our body, it stores in the bones along with calcium.
- During pregnancy, lead will be released from mothers bones along with calcium exposing the fetus or breast feeding to the infant.
- This can result in causing the baby to be born too early or too small.
- Damage the brain, kidney ad nervous system of the baby,
- Increases chances of behavioral problems
- Risks miscarriage
-Adults:
- Cardiovascular effects,hypertension
- Decreased kidney function
- reproductive issues (men and women)
Source: https://www.epa.gov/lead/learn-about-lead
WEIGHING HIGH AND LOW VOLUME MICROFIBER FILTER SAMPLES (05/31/2023)
Goal: Document initial weight of each filter sample before it is placed in in high or low filters where it will then collect aerosol particles.
Instrument used: Sartorius R300S Digital Scale
Method:
1. Placed a slightly folded weighing on balance scale to prevent contamination to samples.
2. Closed all sliding doors of instrument to prevent air particles from entering. Allow scale to zero.
3. Once done, open sliding door and carefully place filter sample on weighing paper using clean tweezers and close sliding doors.
4. Patiently wait for the instrument to precisely record the weight of the filter sample.
5. Repeat this process two more times for same filter sample in order to improve precision.
6. Once done, repeat previous steps for next filter sample.
Figure 2. Weighing initial weight of High and Low volume filter samples.
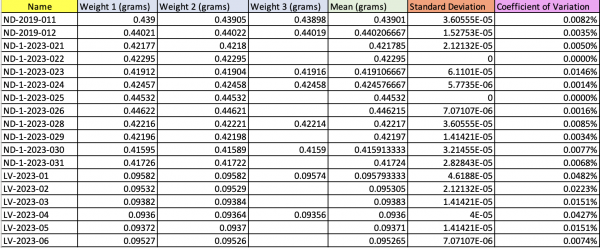
RECORDED DATA FOR INTIAL WEIGHHT OF EACH HIGH VOLUME AND LOW VOLUME FILTER SAMPLES (05/31/2023)
Figure 3.Initial weight of each filter sample (High and low volume). Standard deviation and Correlation of Variation values were very low suggesting that initial weight values are precise.
Biological chemistry:
- Lead from existing sources such as cars that use leaded gasoline, exists/evolves into a variety of Pb+2 compounds.
- Lead is found to affect the regulation and function of zinc and calcium proteins
- An example of this is Lead inhibiting a zinc protein called ALAD (zinc enzyme δ-aminolevulinic acid dehydratase)which leads to anemia in both children and adult with high blood levels
- From previous research, it seems that Lead has a knack for bind to Cysteine residues for Zinc sites/proteins.
- Lead seems to have a stronger binding/binding affinity than zinc for zinc protein sites/binding sites.
- Lead leads to neurological problems due to interfering with the normal function of calcium to perform exocytosis and much more
- Lead also has a stronger binding affinity/tighter bond than calcium to these protein sites that are dependent on calcium.
Source: https://www.sciencedirect.com/science/article/pii/S1367593100001940?via%3Dihub *More information to come soon.
Why General Aviation uses leaded fuel?
- Most aviation uses a fuel called Agvas which contains tetra-ethyl lead as an additive.
- Lead is used as an additive to help boost fuel octane/increase the stability of octane in order to resist compression before spontaneously igniting (Un-intended combustion). Enginges are designed to burn fuel in controlled combustion.
- Lead helps prevent Konck and engine issues that could result in loss of compression.
- Without TEL, octane levels will be for some engine aircrafts
- A main reason is because some airplanes will develop maintenance issues if unleaded fuel is used.
Sources:
- https://www.eia.gov/energyexplained/gasoline/octane-in depth.php#:~:text=Octane%20ratings%20are%20measures%20of,ignite)%20in%20a%20testing%20engine.
Timeline of project:
- 05/30/2023: Began Project on observing and documenting Lead Particulate matter measurements.
- 05/30/2023-06/02/2023: Dr.Delene discusses with UND Aerospace regarding on placing a High volume Filter around the general aviation airport.
- 05/30/2023:Begain weighing filter initial weight using Sartorius R300S Digital Scale.
- 06/02/2023: Built and placed High volume Filter at its desired location and began running 24-hour daily samples.
- 06/07/2023:Dr.Delene and REU Student(Alex Mendez)figured out how to get Flow Rate from GFK High volume filter.
- 06/13/2023:Using X-Ray Fluorescence, we were successfully able to be dectected, but at very low concentrations. This may be because the plastic (the plastic is used in order to prevent the loose particles on the filter from getting sucked by the vacuum in the XRF which could pose a risk to lab and scientist in there,) of the tube the sample is put in may absorb some of the radiation, thus decreasing the amount of signal that could be produced by lead. As well as running daily samples may not be enough to get a good signal of lead on the samples.
- 05/24/2023:The UL94 agreement between Swift fuels and UND has been signed.
- 06/15/2023:delivery of first tanker of Swift UL94 (8529 Gallons) at UND Aerospace.Another tanker will is delivered the next day (06/16/2023).
- 06/?/2023: Began using Precision scale in third floor of Clifford hall to weigh filters. Find the name of it.
- 06/23/2023: Ran a test sample, with about 2 grams of Lead sulfide on filter and used XRF to test and see if we will get a signal showing a high concentration lead on the filter. Test was succesful.
- 06/23/2023: Decided that we will run a week long sample(put sample on here) during the transition period from 100LL fuel to UL94 which will probably last to 06/30/2023.
Lead Emissions:
*Research Articles*
- Modeling of Lead Concentrations and Hot Spots at General Aviation Airports
#Please note, most information has been copied and pasted directly from this article only for review purposes. All credit goes directly to author.#
- The most concentrated areas of piston-engine aircraft activity are general aviation airports.(Stephen N. Feinburg)
- Aircraft operations were observed at three general aviation airports to develop spatially and temporally resolved emissions inventories: Richard Lloyd Jones, Jr., Airport (RVS) in Tulsa, Oklahoma; Centennial Airport (APA) in Englewood, Colorado; and Santa Monica Airport (SMO) in Santa Monica, California.(Stephen N. Feinburg)
- In October 2008, the U.S. Environmental Protection Agency (EPA) promulgated revisions to the Pb NAAQS that lowered the acceptable level by an order of magnitude (to 0.15 μg/m3 based on a rolling 3-month average concentration).
- *these facilities include airports with piston-powered aircraft activity sufficient to produce an estimated annual Pb emissions of 1.0 ton or more.*
- Dispersion Modeling of Lead Emissions from Piston Engine Aircraft at General Aviation Facilities
- The airport samples had on average four times the concentration of the background site, while maximum daily concentrations were 25 times as great at the airport. The mean daily PM10 lead concentration at the airport was 30 ng/m3, with a maximum daily concentration of 302 ng/m3 at the end of a runway.
- The sampling location with the highest impact measured an average daily concentration of 85 ng/m3 approximately 30 to 40 m from the end of the runway.
- Has good figures that can be used as background for lead emissions! not interested in monitoring, only looking for measured lead emissions background info.
- General Aviation Airport Air Monitoring Study
- Has good figures with (Table 4 and Figure 7) with average concentration levels of lead in nanograms (I believe) in two phases. Very useful background info for lead.
- Development and evaluation of an air quality modeling approach to assess near-field impacts of lead emissions from piston-engine aircraft operating on leaded aviation gasoline
- Good figures and recorded data on daily emissions from general aviation regarding lead concentration in n anograms. would be good to compare from other papers and see if it averages out with the rest.
- Source analysis of global anthropogenic lead emissions: their quantities and species
- Might be useful to find lead emission numbers, references are very good!
- Changes of emissions and atmospheric deposition of mercury, lead, and cadmium
- Good references! and nice numbers/figures that could possibly be used as background
IN-DEPTH REVIEW OF CHOSEN ARTICLES FOR LEAD EMISSION in air/soil/etc… from General aviation/lignite combustion/etc…
- Integrated Science Assessment For Lead(EPA)
- Look at Table 1-1. Nice table looking at lead concentration in non-urban soil. Contiguous U.S. Median: 15 mg Pb/kg (dry weight)
- Figure 2-1/2-2/2-3. Nice figure to show trend in Pb emission from stationary and mobile sources. In 2008, nonroad Pb emissions from piston-engine aircraft were slightly lower at 550 tons,1 which represented 58% of all Pb emissions. 2008 pistonengine aircraft emissions were comprised of 254 tons of Pb from emissions at or near airports and 296 tons of Pb emitted in flight (i.e., outside the landing and take-off cycles).
- Figure 2-4. County-level Pb emissions (tons) in the U.S. in 2008
-Tetraethyl Pb was included since it is still used in piston-engine aircraft fuel. Gidney et al. (2010) point out that, where tetraethyl Pb is used as an additive in piston-engine aircraft fuel, the fuel also contains ethylene dibromide, which reacts with Pb to form Pb bromide and Pb oxybromides. Pb bromides and Pb oxybromides are more volatile than elemental Pb at combustion temperatures and are therefore exhausted from the engine. After being exhausted, the brominated Pb compounds cool to ambient temperatures and condense to form sub-micron solid particles. In contrast, emissions of organic Pb would remain largely in the vapor phase at ambient temperatures.
-The ASTM specification for the maximum Pb content in “100 Low Lead,” the most commonly used leaded piston-engine aircraft fuel, is 2.12 g of elemental Pb/gallon
-Fuel consumption for piston-engine aircraft operating at one airport in the U.S. was estimated to range from 1.6 grams per second (g/second) of fuel during taxi-out, to 15.3 g/second of fuel during run-up preflight check for single-engine aircraft; and 5.1 g/second during taxi and 50 g/second during preflight run-up check for twin-engine aircraft (Carr et al., 2011). Fuel consumption rates for aircraft listed in FAA’s Emissions and Dispersion Modeling System were used to develop the Pb emissions inventory for piston aircraft that are discussed in Section 2.2.1. EPA estimates that on average, 7.34 g of Pb is emitted during a landing and take-off cycle conducted by piston-engine aircraft (ERG, 2011).
- Figure 2-9. Shows nice figure of how lead travels from a source.
-

